
Home
This project is done in Proscom for High School of Economics
👩🏼💻 My role
Lead Product Designer (phase 1) and Design Director (next phases)— research, prototyping, leadership, contributing to design, interaction with stakeholders, mentorship, defining processes, creating vision and strategy.
👨🏾💻👩💻 Team
5 Product Designers
2 Product Managers
2 UX-Reseachers
3+ Developers
📈 Outcome
+8% User Engagement Metrics
+30% Course Resumption Rate
-12% Process Time Metrics
+16% Student NPS score
📜 Background
High School of Economics — one of the leading and most renowned universities in Russia, founded in 1992. Since then, dozens of products have been created that needed improvements. The company required a change in product strategy, a transformation of the approach to user-centric design planning, as well as the creation of a unified ecosystem for seamless transition between HSE products.
💭 Summary
As a Lead Designer, my mission was to incorporate a user-centric approach into the company's workflow. The HSE LMS project was a pioneering initiative where I demonstrated the product design approach using top-tier UX practices. In my role, focusing on student access, I conducted a thorough analysis of existing data, set objectives in collaboration with the Product Lead, and established UX OKRs for various stages, breaking them down into targeted tasks aimed at achieving both specific outcomes and overarching goals. I steered this process using agile methodologies, including daily meetings and demos, coupled with mentorship and open communication, to ensure successful implementation and continuous improvement.
The HSE LMS product is built on the Moodle engine, which allowed teachers and administrators to create temporary solutions that met the various needs of students and teachers. I realized that figuring out who did what and why was difficult, so I decided to take a closer look at them to understand what exactly necessitated frequent changes.
When I studied the analytics reports from HSE's side, student evaluations (NPS), product reviews on social media, and compared them with competitors, I noticed a certain pattern. These data hinted that the information structure of the product was inefficient. It was like a star, satisfying the needs of different audience groups. A user could start from the center of the 'star' and end up on a ray that was completely irrelevant to them.
As a result of the analysis, I recorded the following indicators:
🟡 Alarmingly low 'ease of use' scores in the NPS reports, along with a significant number of mocking videos on social media dedicated to suboptimal navigation, leading to low user satisfaction.
🟡 Students were missing notifications from teachers, information about class cancellations, and changes in classroom locations — this information was hard to find, leading to reduced learning efficiency and a lower overall academic performance of the students.
🟡 Students regularly approached administrators with requests to explain where to find academic information.
🟡 Students grouped together in external services to exchange academic information, as well as for social interaction.
To delve deeper into the problem, I initiated an expert UX audit among designers to assess the current state of the product.

To delve deeper into understanding user problems, I collaborated with the UXR team to prioritize and conduct field research. Along with a team of UX researchers, we joined a group of freshmen during the exam period to observe their first experience interacting with the LMS while submitting exam materials.
We discussed their academic life, the process they went through that semester, and the process of submitting assessment materials. We also surveyed the teachers' side to identify the difficulties students encounter and what, in the teachers' opinion, hinders students from achieving their academic goals.
After connecting with UX researchers from the tribe representing teachers' interests, we constructed a Customer Journey Map (CJM), where we documented the problems, pain points, desires, and behaviors of users from both sides. I organized a meeting with stakeholders to jointly discuss needs and pain points.
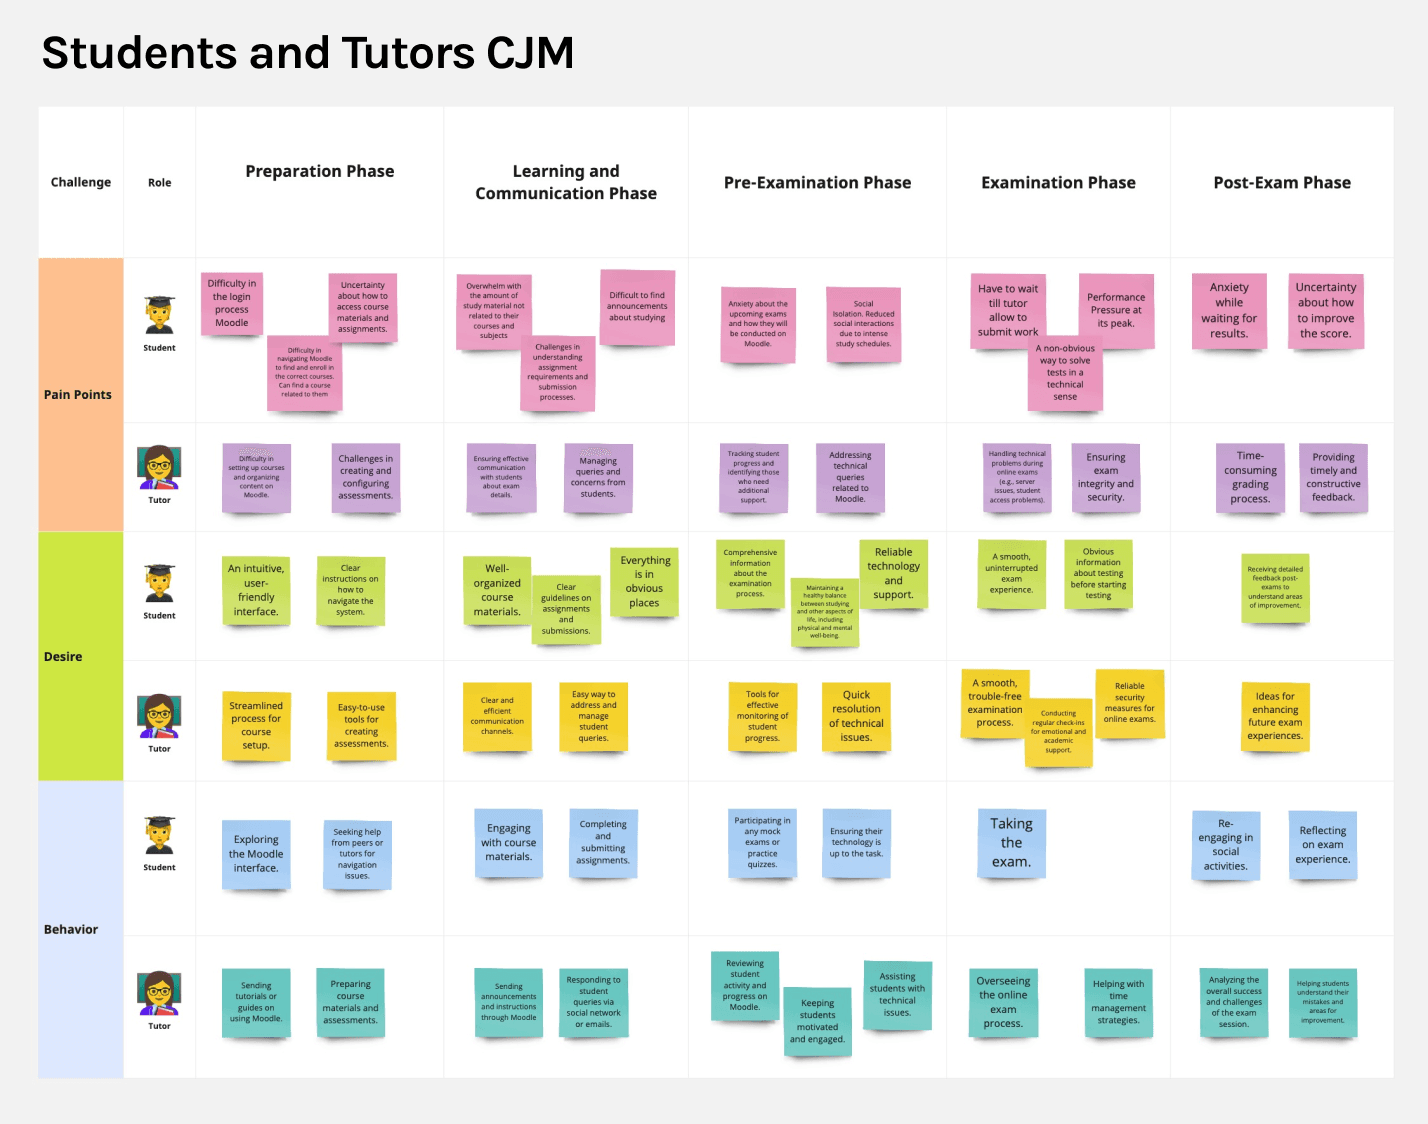
Through the creation of the map, we concluded that the current Information Architecture (IA) does not meet the needs of both sides. Technical difficulties encountered by students lower their academic performance, lead to interactions in additional services, and reduce the overall satisfaction with education at HSE.
Problem definition
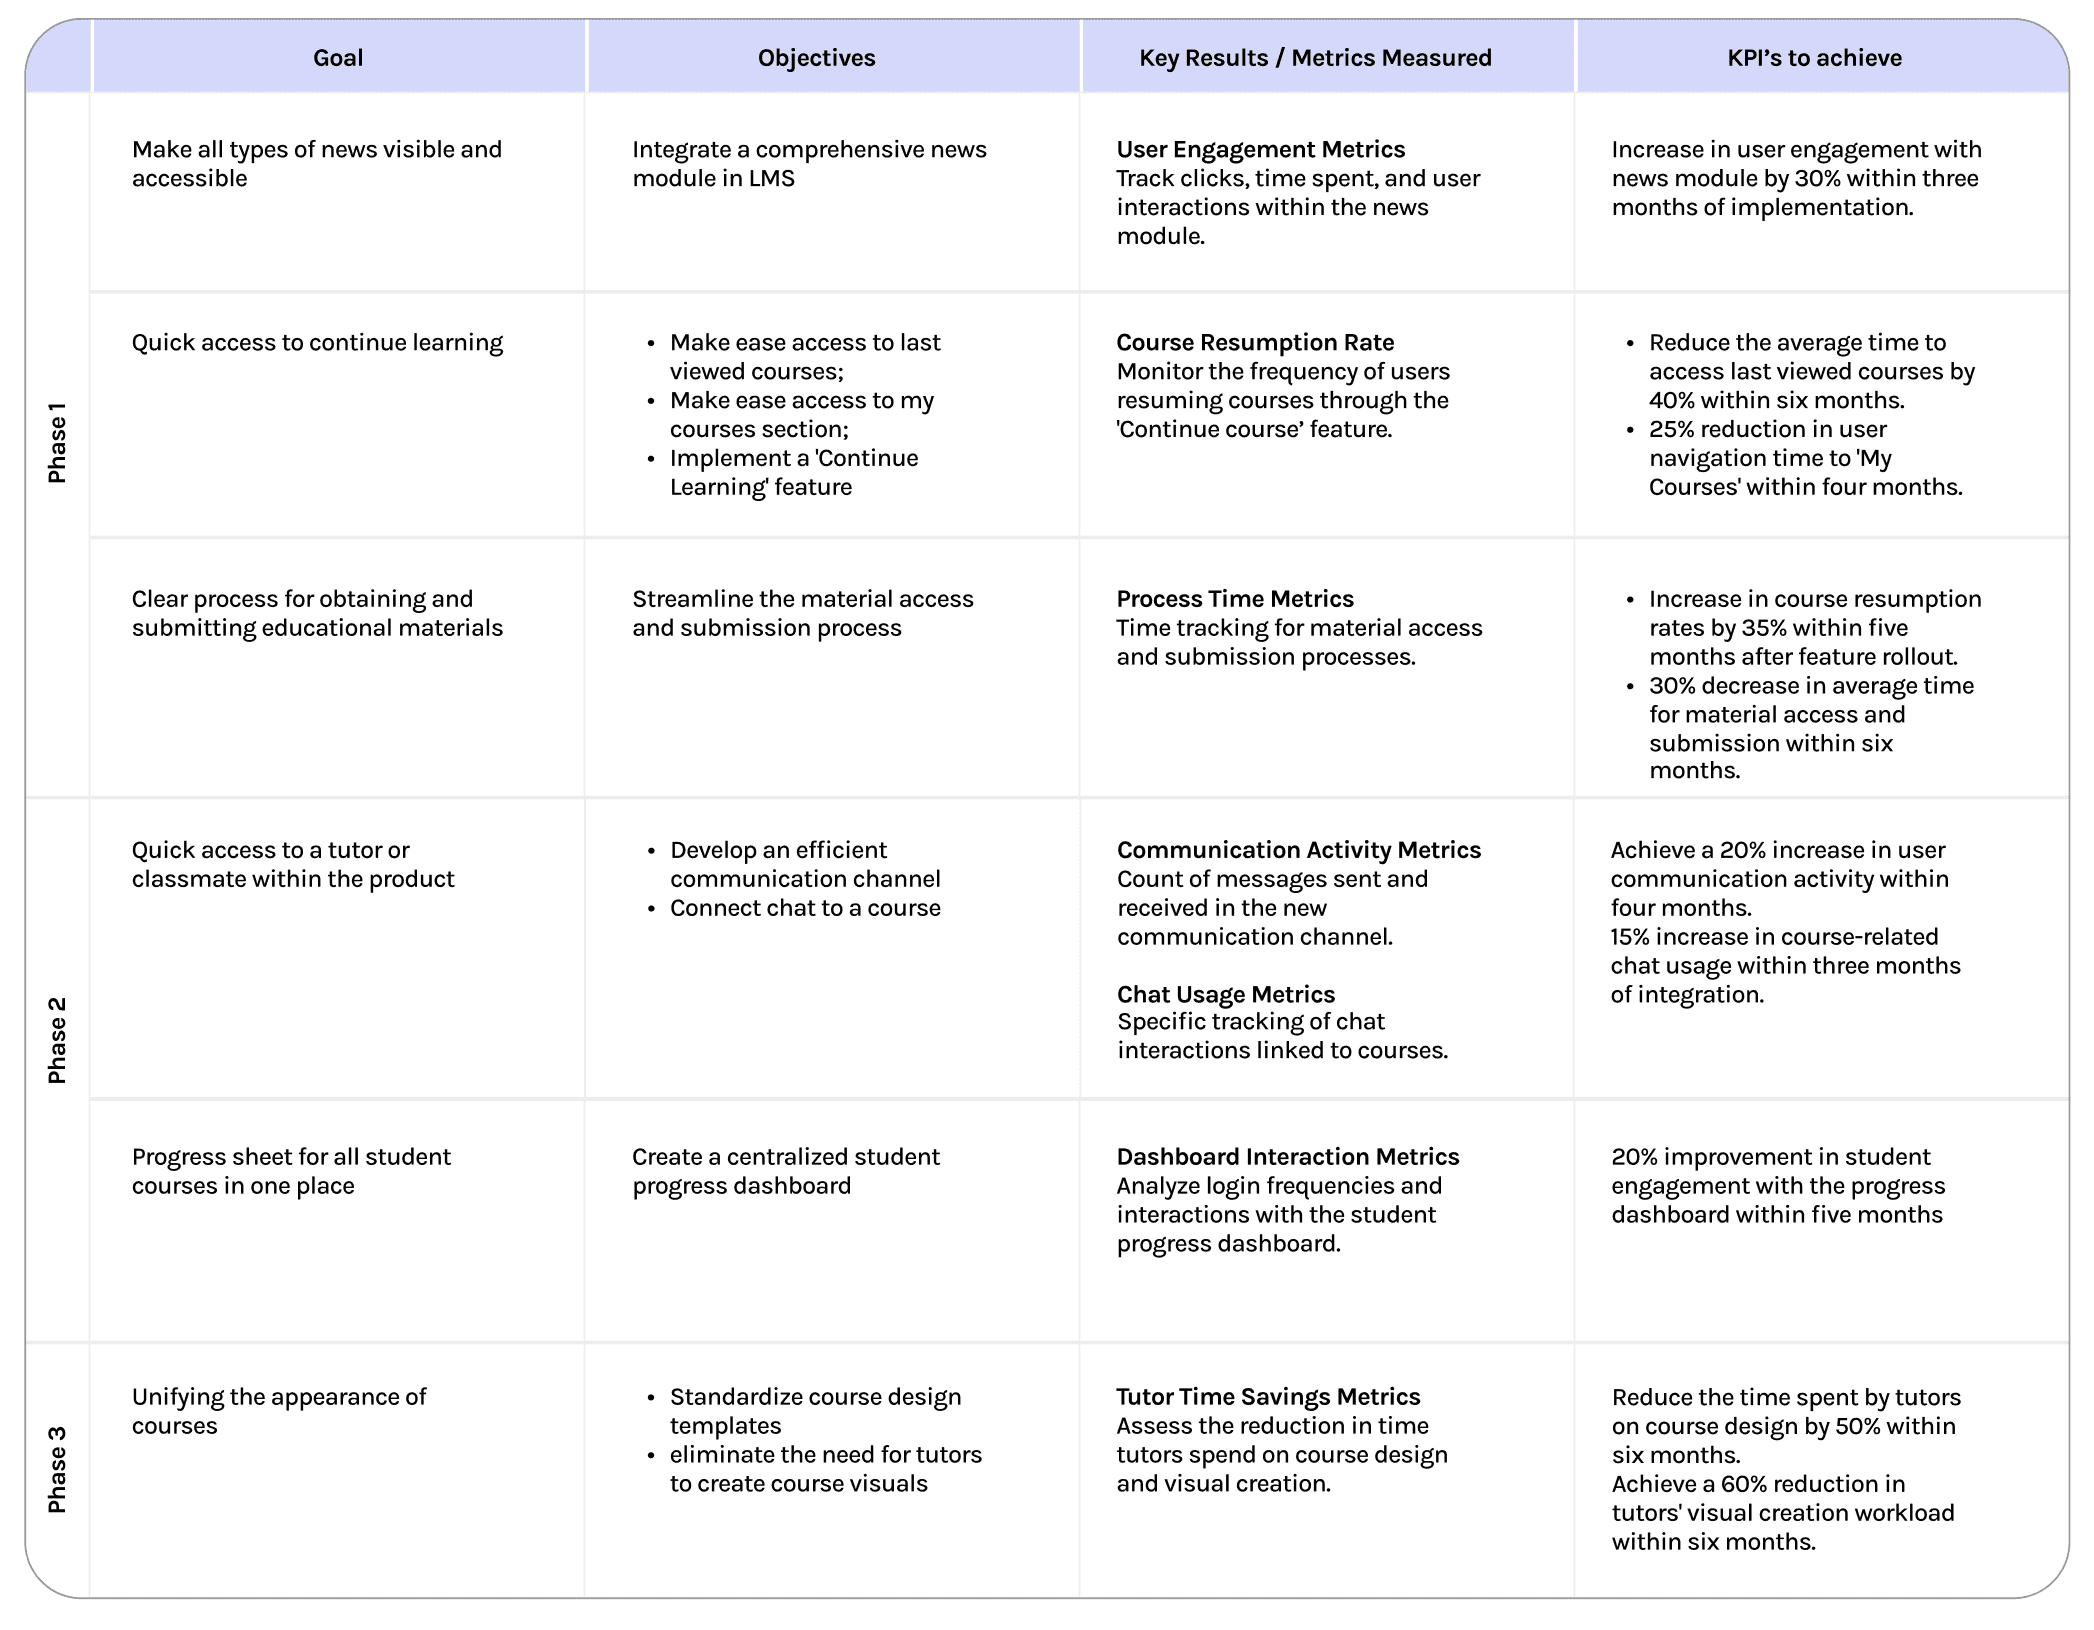
Since we were limited in time and needed to complete the current project cycle before the start of the new exam session for students, we, along with the stakeholders and the product lead, used the Impact/Effort Matrix for an initial round of prioritization and then applied the RICE model for a deeper analysis of the more complex or high-stakes tasks.

Due to time constraints, we allowed ourselves some flexibility and confirmed task priorities with stakeholders using the MoSCoW method, where:
Must Have — make all types of news accessible, quick access to the continuation of learning
Should Have — a clear process for obtaining and submitting study materials, quick access to a teacher or classmate within the product
Could Have — a performance list for all of a student's courses in one place, standardization of the appearance of courses
Won't Have — changes to the test-taking system, changes to the login process, onboarding on how to use the LMS.
In the second session of the meeting, we discussed with stakeholders the metrics that we will use to measure its effectiveness and impact.
I start the session with a warm welcome and a brief overview of our objective. To break the ice and get the creative juices flowing, we begin with a quick, fun activity. It's light-hearted and sets a positive tone for the day.
After that i’ve introduced the team to the specific challenges and objectives of the project, along with the key performance indicators (KPIs) we aimed to achieve. Collaboratively analyzed over a dozen competitors, identifying and documenting best practices and principles to guide our design strategy.
Assigned tasks based on different web pages, identifying a core set of pages and mapping out transitions between them.
At the second stage of the session I’ve offered divid the team into two groups, each responsible for a specific module of the LMS. The first group focused on enhancing user notification and information on the homepage and course learning page. The second group brainstormed improvements for the educational process on the same pages.
The targeted approach on the homepage and learning page ensured that efforts were concentrated on areas with the highest impact.


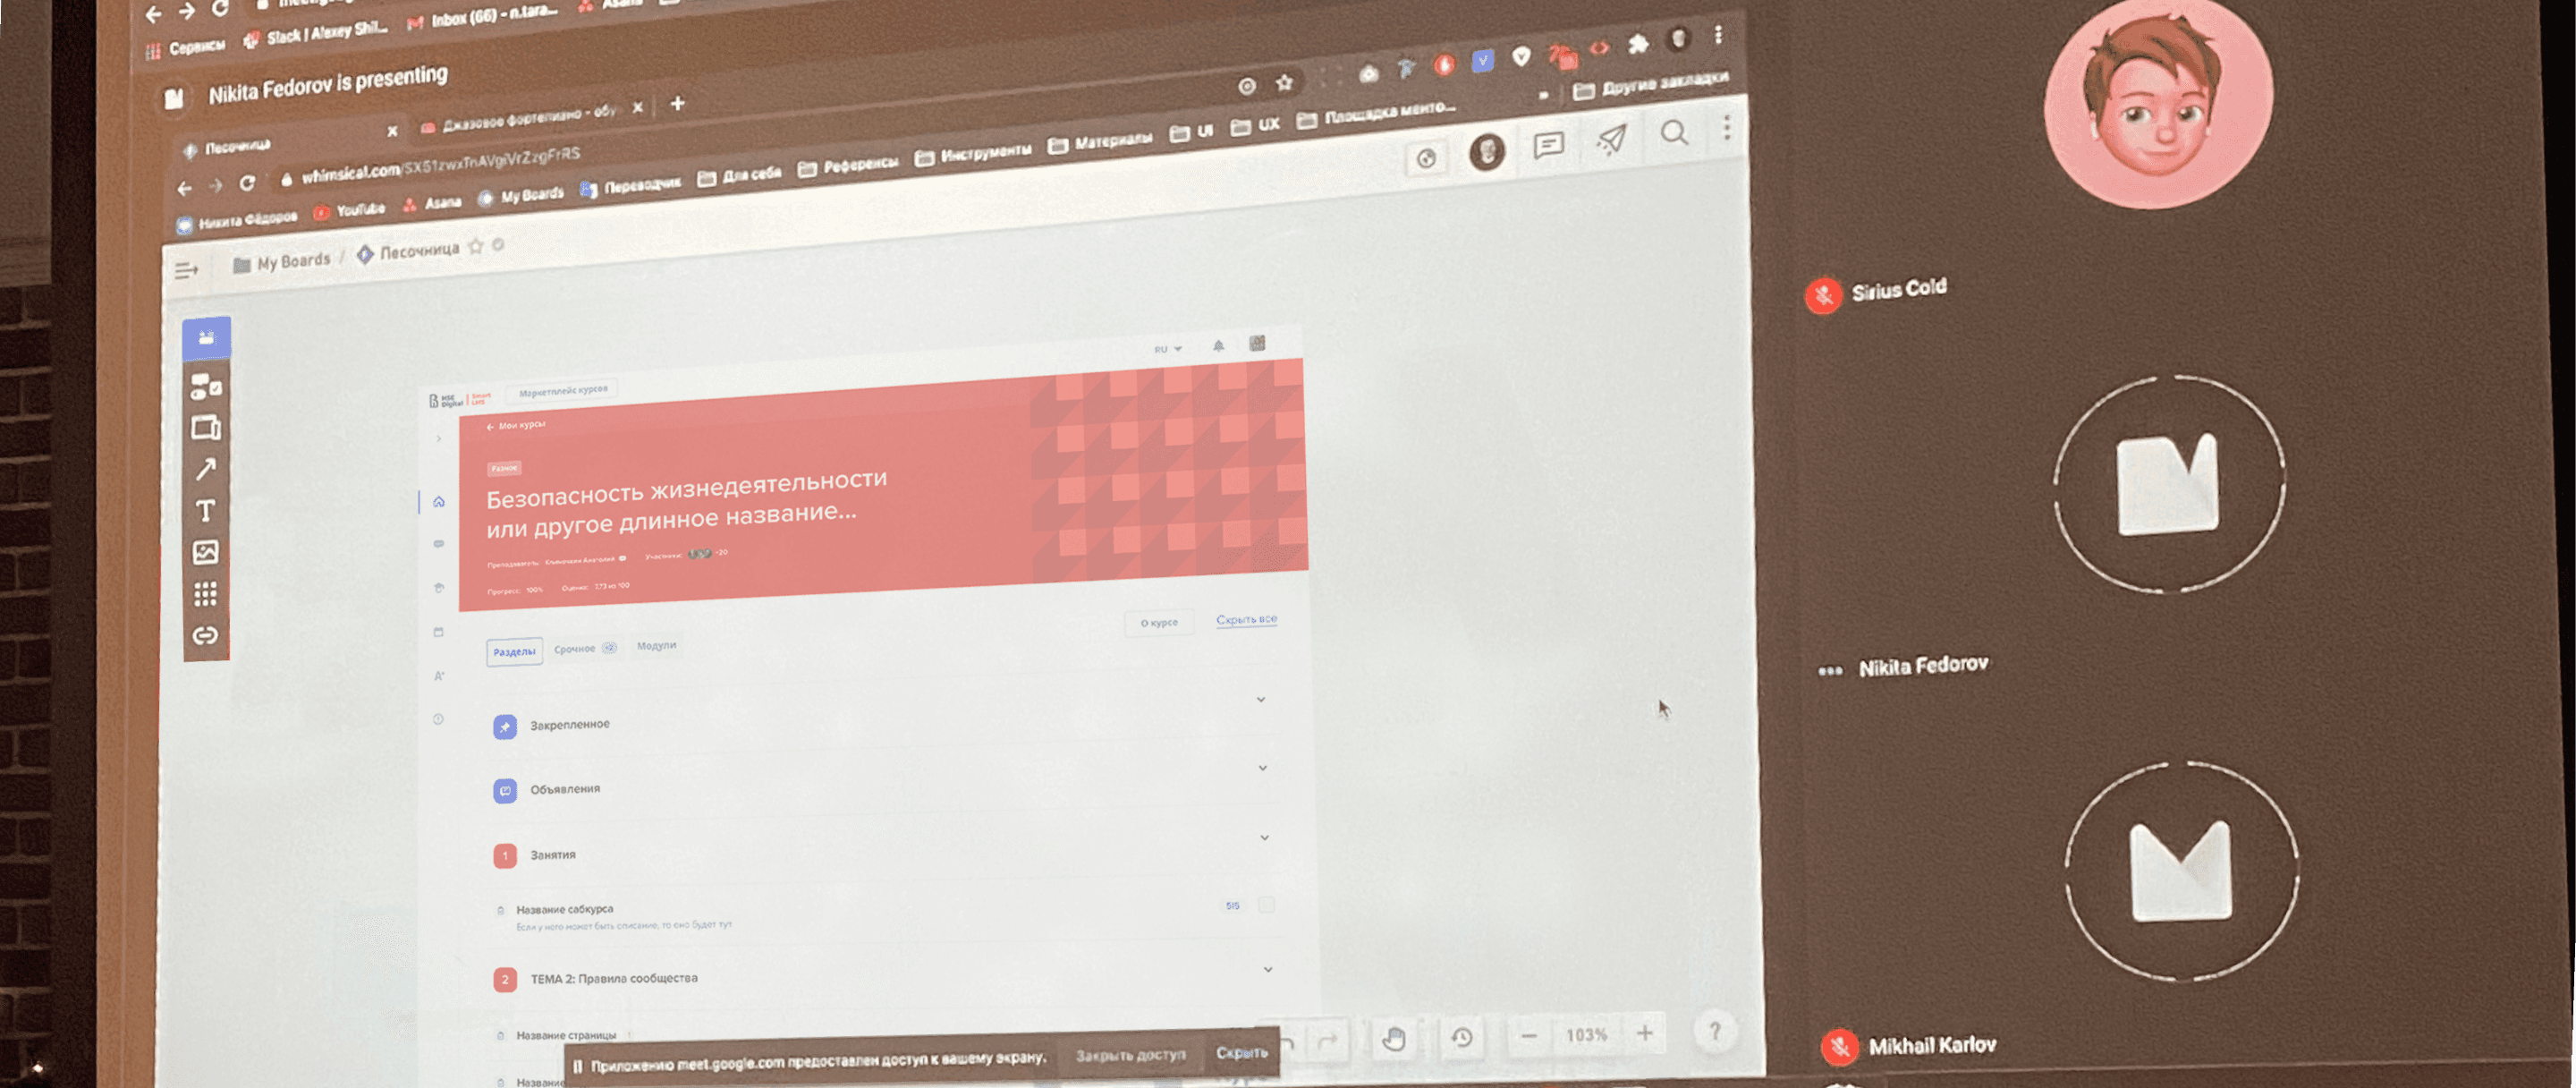
For the session, I invited a developer who helped understand the capabilities of the Moodle system. Thanks to the creative potential of the team, we managed to find a testing solution that matched the technical possibilities.
In pursuit of efficiency and adaptability, I have integrated agile methodologies into our workflow, aiding the team in navigating challenges and obstacles effectively. While I consistently encourage the exploration of creative solutions, I also ensure that each task in Anasa is accompanied by comprehensive documentation. This practice aligns our innovative efforts with the practical constraints of each project. My role involves guiding the team to strike a balance between innovative design and the practical realities of feasibility and business objectives.

As a result of creating all the screens that enabled us to achieve the set goals, I, together with the team of UX researchers, conducted moderated and unmoderated testing. Our goal was to find out if students could:
🤔 easily find and access all types of news updates within the LMS.
🤔 continue learning quickly
🤔 obtaining and submitting educational materials.
🤔 find a tutor or classmate from the specific course
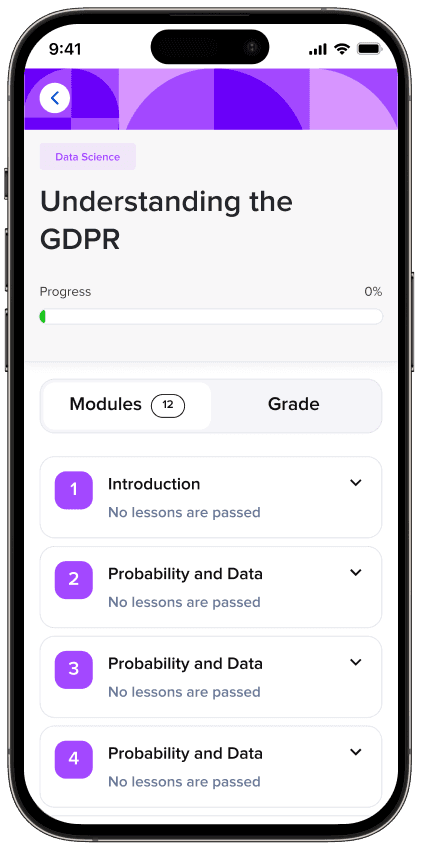
Overall, the testing gave positive results, but tabs of the course page were misunderstood, so I rethought some information.
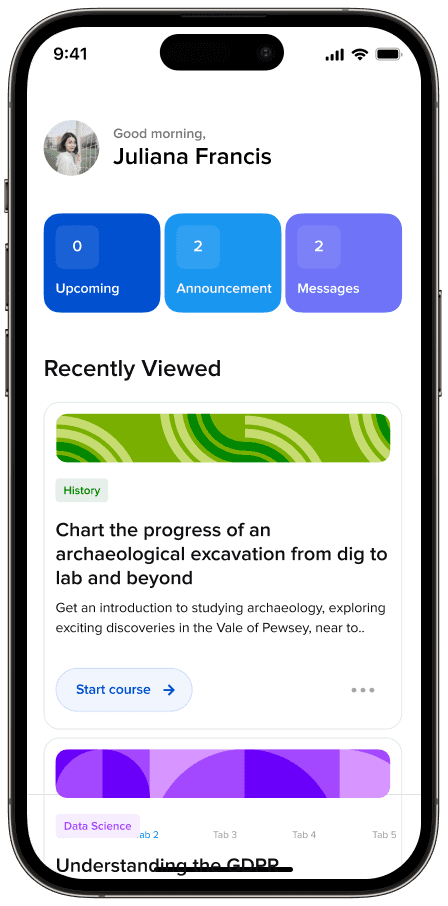
From the Phase1 after the first three months of using the updated Desktop LMS and LMS App
Course Resumption Rate
Process Time Metrics
User Engagement Metrics
Student NPS score
This video with screens represents the culmination of various development phases. This outcome is a testament to our team's synchronized efforts and effective leadership throughout the project.
As a leader, I spearheaded the transformation of our team's approach to be more user-centric. I emphasized the importance of data-driven decision-making, ensuring that every strategy and design choice was informed by solid data. We transitioned from intuition-based methods to a more empirical approach, grounding our decisions in user behavior and analytics. This shift not only enhanced our product design but also redefined how we measured success. We adopted quantitative metrics to assess our progress, setting clear, numerical goals that aligned with both user needs and business objectives. This new approach not only improved our product development processes but also fostered a culture where user satisfaction and data-informed decisions became the cornerstones of our workflow.
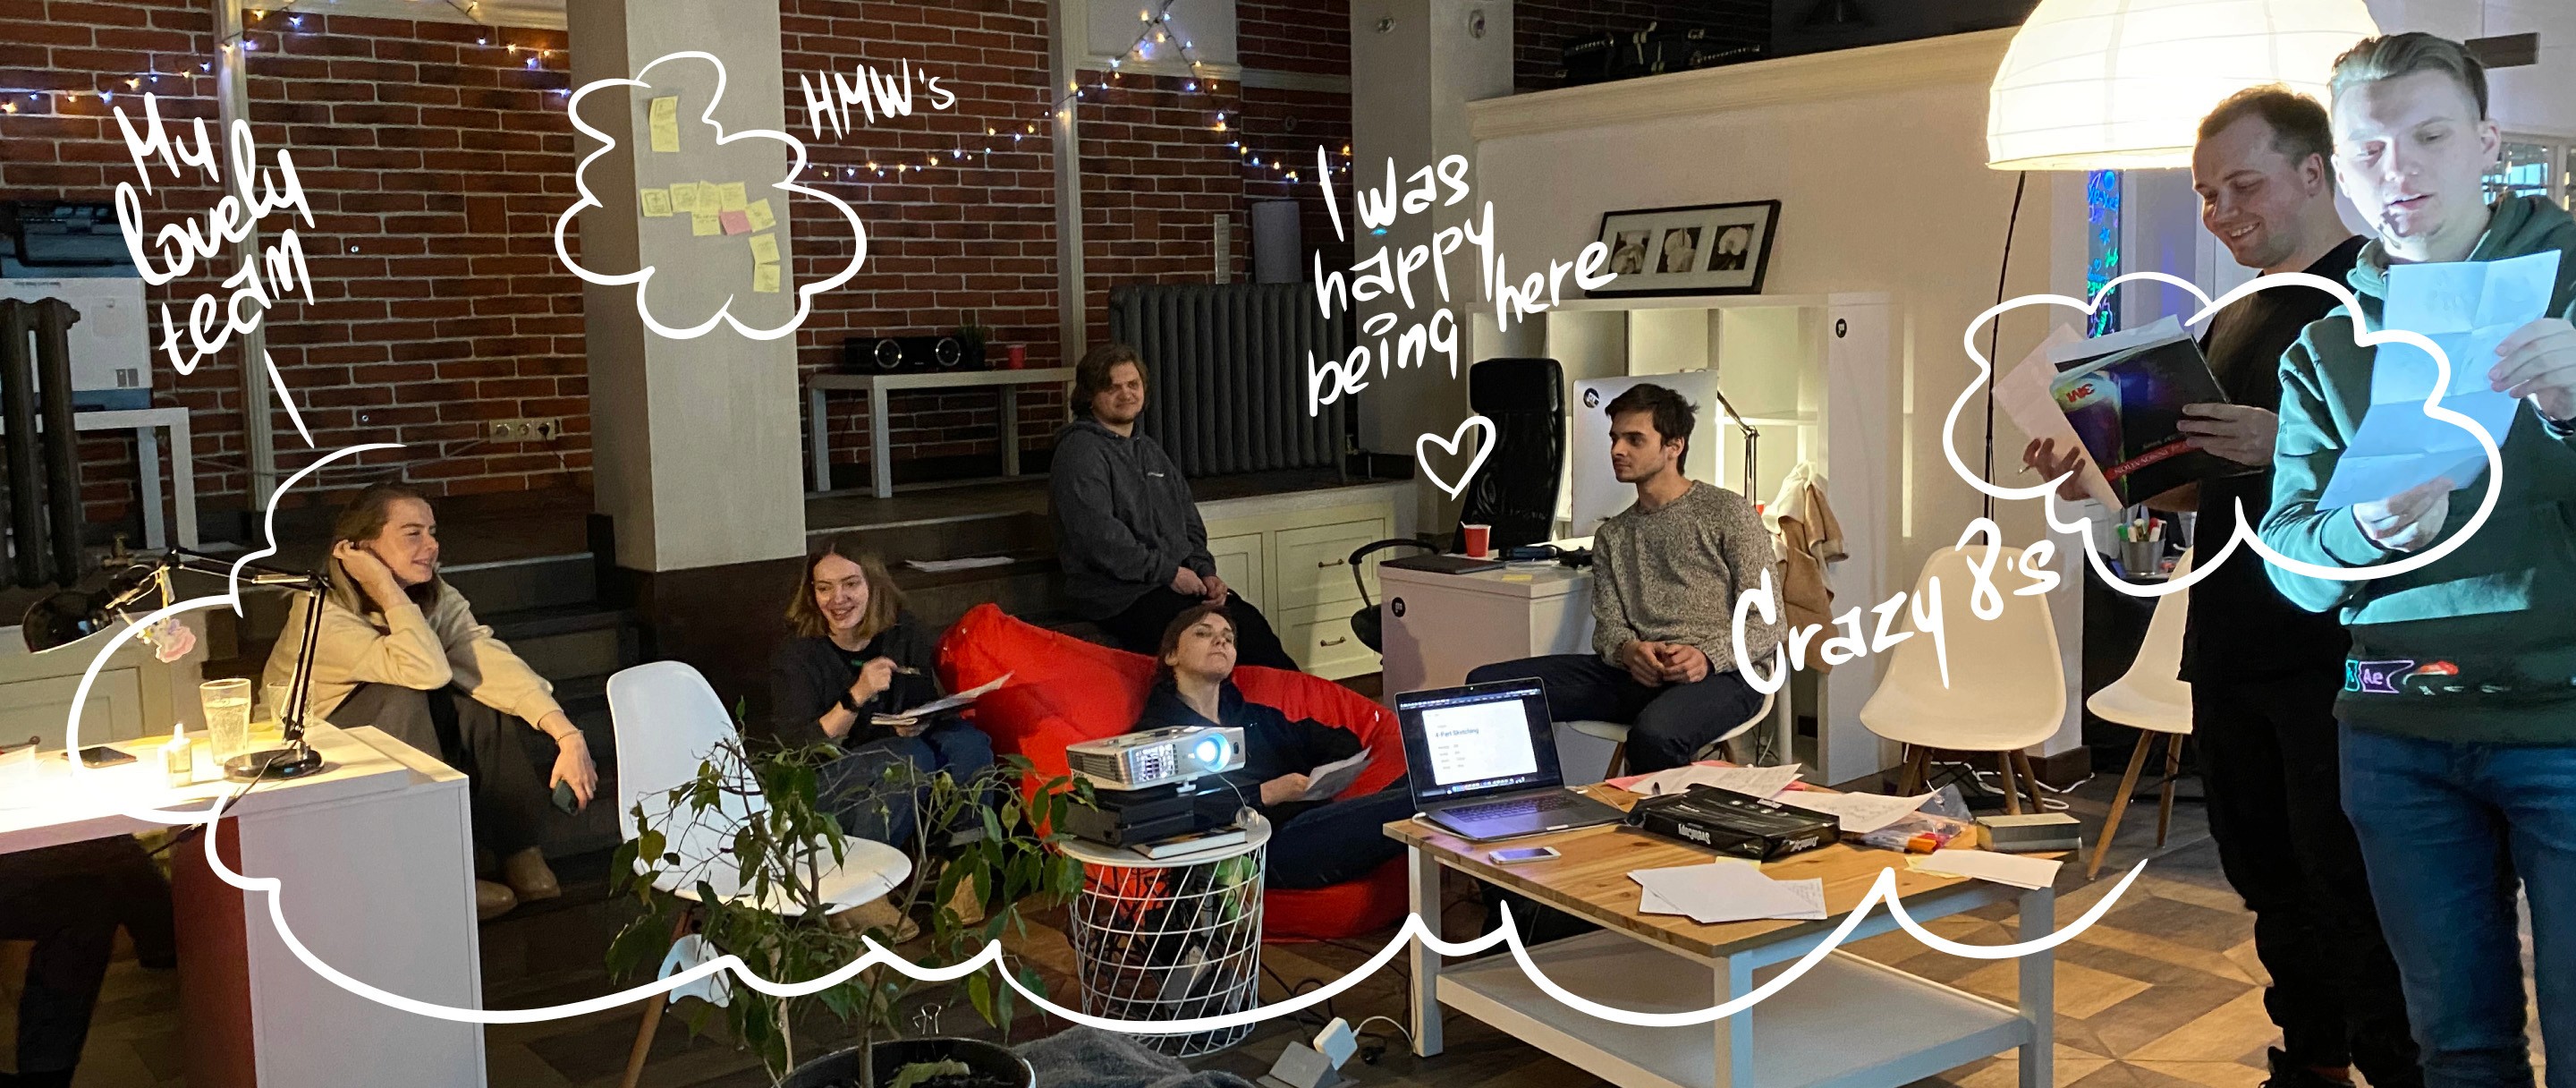
In my journey as a team leader, I observed how significantly corporate culture impacts team productivity. Beyond achieving various successes, I noticed the profound effect of fostering a collaborative and supportive environment. I initiated a practice of engaging team members in Sunday group activities, which unexpectedly turned into a powerful tool for motivation. These gatherings, beyond being technical workshops, served as a platform for team bonding, shared learning, and collective motivation. This initiative not only boosted our performance but also enhanced the overall morale, proving that a positive, unified culture is key to driving team success.
Due to my strategy established previously, I handed over the leading position, remaining as a Director and validator of actions. Then, I moved to the tribe that deals with mobile products of the Higher School of Economics and engaged as a Lead Designer in adapting data and user experience from the desktop version to the HSE LMS mobile application, but this is a story for the next case study :)
Elevating User Engagement by 30% and Improving Academic Performance by 25%
Case study